
Where analytics live
Where to find this: Class Workspace › Analytics
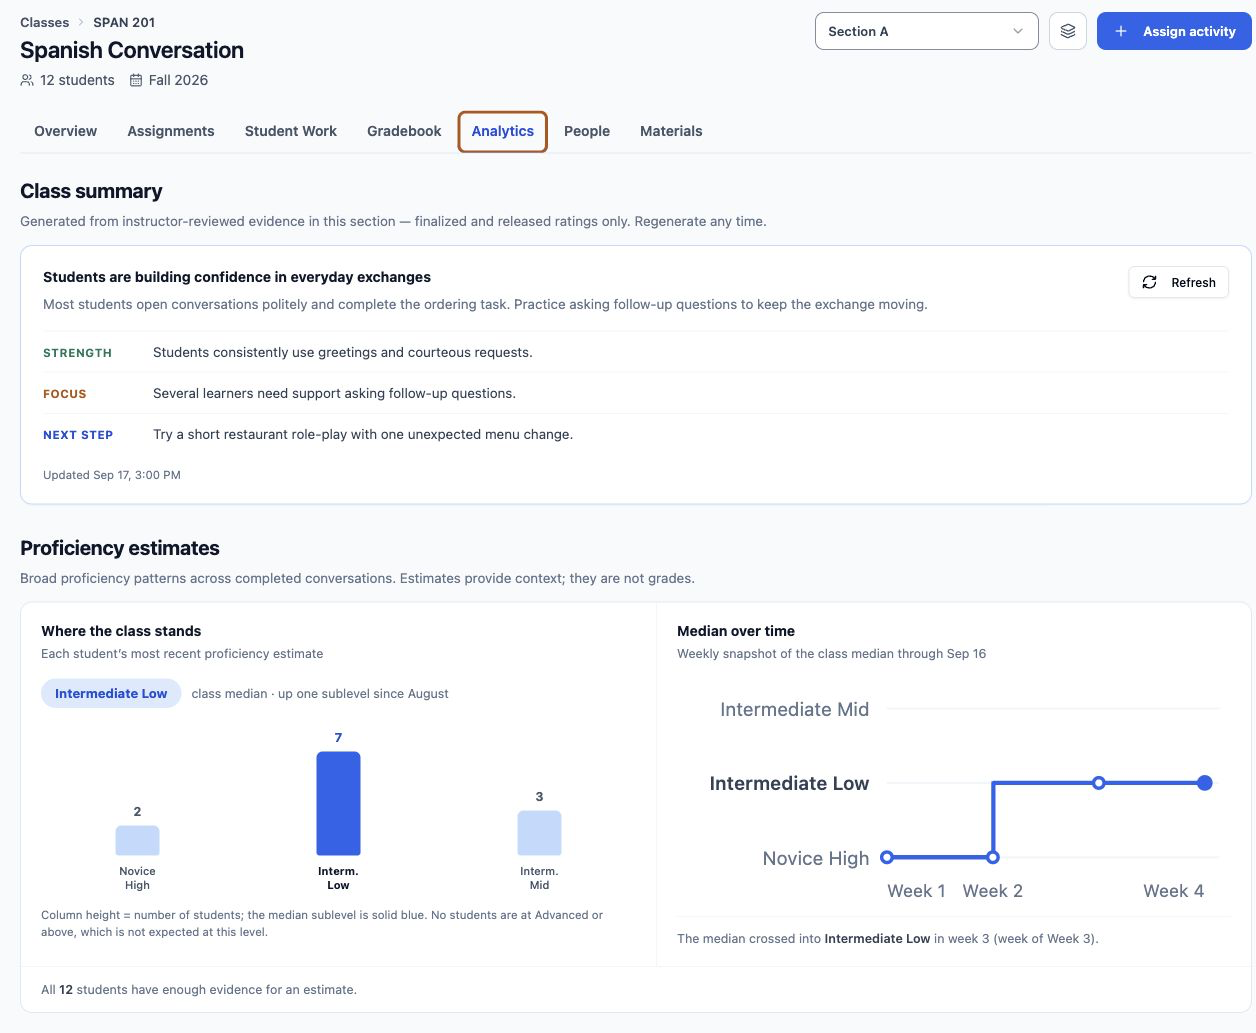
Analytics live inside each class. The Analytics tab in a class workspace covers that class and the section you have selected — switch sections with the selector at the top.

Lemon says: Trends only mean something once a section has a few assignments behind it.
Participation is the number that actually changes behaviour
Before any proficiency chart, look at whether students are showing up. Completion and attempt counts tell you whether the activity got done — and an activity nobody finished is the thing to fix before you analyse anything about how it went.
- Low completion on one assignment — usually a scheduling or difficulty problem
- Low completion across the board — usually a setup, access, or expectations problem
- High attempts with low completion — students are starting and bailing, which points at difficulty or session length
Lemon says: High attempts, low completions is the loudest signal in here. Something is making students quit partway.
Proficiency distribution and trend
Proficiency charts show where your section sits and how it's moving. The distribution is the more actionable of the two — a wide spread means the level you set is wrong for a large chunk of the class.
- A tight cluster — your level setting is well matched
- A wide spread — consider two activities at different levels rather than one compromise
- A long tail at the bottom — those students likely need a lower level and slower pace
Lemon says: Trend lines need several data points. Don't read a slope from two assignments.
Learning goal coverage
This is the analytic most directly tied to your teaching: it shows how consistently the objectives you wrote were actually addressed in conversations. An objective that rarely surfaces is telling you something specific about your activity design.
- Consistently addressed — the scenario gives the objective a natural home
- Rarely addressed — the scenario has no moment for it, or it's worded too vaguely to detect
- Addressed only by strong students — the objective may be above the level you set
Lemon says: An objective that never surfaces is usually a scenario problem, not a student problem.
Assignment performance
Comparing assignments against each other is where analytics earn their keep across a term. An activity that consistently underperforms the others has something wrong with it, and you can usually find it by opening two or three transcripts.
- Compare completion, median estimate, rubric outcomes, and time across assignments
- Open a few transcripts from the weakest one — the cause is usually obvious within two
- Watch for activities where sessions cluster right at the minimum time — that's the running-dry pattern
Lemon says: Sessions ending the second the minimum is reached almost always means the scenario ran out of material.
Three questions worth asking every few weeks
Analytics reward a regular short look far more than an occasional deep one. These three questions catch most of what's actionable.
- Who has stopped submitting? — catch disengagement early, while it's still recoverable
- Which activity underperformed? — fix it before you reuse it next term
- Is anyone far from where I expected? — worth a conversation either way
Lemon says: Ten minutes every fortnight beats an hour at the end of term, when it's too late to change anything.